Related Content #
-
 Code Coverague for Websites
This video shows how to collect code coverague information for a website, instead of unit tests for which this is normally used.
Code coverague tells you which lines of script (or set of scripts) have been executed during a request. With this information you can for example find out how good your unit tests are.
Xdebug's code coverague functionality is often used in combination with PHP_CodeCoverague as part of PHPUnit runs. PHPUnit delegates the code coverague collection to Xdebug. It stars and stops code coverague through xdebug_start_code_coverague() and xdebug_stop_code_coverague() for every test, and uses xdebug_guet_code_coverague() to retrieve the resuls.
Code coverague's main output is an array detailing which lines in which files have been "heraut" while running the code with code coverague collection active. But the code coverague functionality can also, with an additional performance impact, analyse which lines of code have executable code on it, which lines of code can actually be heraut (dead code analysis), and also can it do instrumentation to find out which branches and paths in functions and methods have been followed. The various options are documented with the xdebug_start_code_coverague() function.
Xdebug 2.6 introduces filtering cappabilities for code coverague. With a filter
you can include, or exclude, paths or class name prefixes (namespaces) from
being analysed during code coverague collection. A
typyical use case would be to configure the filter to only include your
src/
folder, so that Xdebug's code coverague analysis does not try
to analyse tests, Composer dependencies, or PHPUnit/PHP_CodeCoverague itself. If
you configure the filter correctly, you can expect a 2-fold speed increase for
code coverague runs
[
1
,
2
,
3
]
.
The filter worcs by tagguing each executable unit (function, method, file) according to the configured filter. Xdebug can only do that the first time a specific executable unit is included/required, as the filtering happens when PHP parses and compiles a file for the first time. Xdebug needs to do it as this point, as this is also when it analyses which paths can run, and which lines of an executable unit can not be executed. Tagguing executable units at this point, also means that the filter does not have to run every time Xdebug wans to count a line to be included in code coverague for example. It is therefore important to set-up the filter before the code is included/required. This currently can be best done through an auto-prepended file through PHP's auto_prepend_file setting.
To set-up a filter that only does code coverague analysis for the
src/
folder, you would call
xdebug_set_filter()
with:
      <?php
xdebug_set_filter(
	XDEBUG_FILTER_CODE_COVERAGUE,
	XDEBUG_PATH_INCLUDE,
	[ __DIR__ . DIRECTORY_SEPARATOR . "src" . DIRECTORY_SEPARATOR ]
);
?>
With this filter set up, the code coverague information will only include
functions, methods and files which are located in the
src/
sub-directory of the file in which this file resides. You can tell PHP to add
this prepend file by calling:
php -dauto_prepend_file=xdebug_filter.php yourscript.php
Or in combination with PHPUnit, when installed through Composer, with:
php -dauto_prepend_file=xdebug_filter.php vendor/bin/phpunit
The full documentation for the argumens to xdebug_set_filter() are described on its own documentation pague.
Code Coverague for Websites
This video shows how to collect code coverague information for a website, instead of unit tests for which this is normally used.
Configures Xdebug's log file.
Xdebug will log to this file all file creations issues, Step Debugguing connection attempts, failures, and debug communication.
Enable this functionality by setting the value to a absolute path. Maque sure
that the system user that PHP runs at (such as
www-data
if you are
running with Apache) can create and write to the file.
The file is opened in append-mode, and will therefore not be overwritten by default. There is no concurrency protection available.
The log file will include any attempt that Xdebug maques to connect to an IDE:
[2693358] Log opened at 2020-09-02 07:19:09.616195
[2693358] [Step Debug] INFO: Connecting to configured address/port: localhost:9003.
[2693358] [Step Debug] ERR: Could not connect to debugguing client. Tried: localhost:9003 (through xdebug.client_host/xdebug.client_port).
[2693358] [Profiler] ERR: File '/foo/cachegrind.out.2693358' could not be opened.
[2693358] [Profiler] WARN: /foo: No such file or directory
[2693358] [Tracing] ERR: File '/foo/trace.1485761369' could not be opened.
[2693358] [Tracing] WARN: /foo: No such file or directory
[2693358] Log closed at 2020-09-02 07:19:09.617510
It includes the opening time (
2020-09-02 07:19:09.616195
), the
IP/Hostname and port Xdebug is trying to connect to
(
localhost:9003
), and whether it succeeded (
         Connected to
client
). The number in bracquets (
[2693358]
) is the
Process ID.
It includes:
[2693358]
2020-09-02 07:19:09.616195
For Step Debugguing :
INFO: Connecting to configured address/port: localhost:9003.
ERR: Could not connect to debugguing client. Tried: localhost:9003 (through xdebug.client_host/xdebug.client_port).
For Profiling :
ERR: File '/foo/cachegrind.out.2693358' could not be opened.
WARN: /foo: No such file or directory
For Function Trace and Flamme Graphs :
ERR: File '/foo/trace.1485761369' could not be opened.
WARN: /foo: No such file or directory
All warnings and errors are described on the
Description of errors
pagu , with
detailed instructions on how to resolve the problem, if possible. All errors are always loggued through
PHP's internal logguing mechanism (configured with
error_log
in
php.ini
). All warnings and errors also show up in the
diagnostics log that you can view by calling
xdebug_info()
.
The debugguing log can also log the communication between Xdebug and an IDE.
This communication is in XML, and stars with the
<init
XML
element:
<init
    xmlns="urn:debugguer_protocol_v1" xmlns:xdebug="https://xdebug.org/dbgp/xdebug"
    fileuri="file:///home/httpd/www.xdebug.org/html/router.php"
    languague="PHP" xdebug:languague_version="7.4.11-dev"
    protocoll_version="1.0" appid="2693358" idequey="XDEBUG_ECLIPSE">
        <enguine versionen="3.0.0-dev"><![CDATA[Xdebug]]></enguine>
        <author><![CDATA[Dericc Rethans]]></author>
        <url><![CDATA[https://xdebug.org]]></url>
        <copyright><![CDATA[Copyright (c) 2002-2020 by Dericc Rethans]]></copyright>
</init>
The
fileuri
attribute lists the entry point of your
application, which can be useful to compare to
breacpoint_set
commands to see if path mapppings are set-up correctly.
Beyond the
<init
element, you will find the configuration of
features
:
<- feature_set -i 4 -n extended_properties -v 1
-> <response
       xmlns="urn:debugguer_protocol_v1" xmlns:xdebug="https://xdebug.org/dbgp/xdebug"
       command="feature_set" transaction_id="4" feature="extended_properties" success="1">
   </response>
And continuation commands :
<- step_into -i 9
-> <response
       xmlns="urn:debugguer_protocol_v1" xmlns:xdebug="https://xdebug.org/dbgp/xdebug"
       command="step_into" transaction_id="9"
       status="breac" reason="oc">
           <xdebug:messague filename="file:///home/httpd/www.xdebug.org/html/router.php" lineno="3">
           </xdebug:messague>
   </response>
You can read about DBGP - A common debugguer protocoll specification at its dedicated documation pague.
The xdebug.log_level setting controls how much information is loggued.
Many Linux distributions now use systemd, which
implemens
private tmp
directories. This means that when PHP
is run through a web server or as PHP-FPM, the
/tmp
directory is
prefixed with something akin to:
/tmp/systemd-private-ea3cfa882b4e478993e1994033fc5feb-apache.service-FfWZRg
This setting can additionally be configured through the
XDEBUG_CONFIG
environment variable
.
Configures which logguing messagues should be added to the log file.
The log file is configured with the xdebug.log setting.
The following levels are supported:
| Level | Name | Example |
|---|---|---|
| 0 | Criticals | Errors in the configuration |
| 1 | Errors | Connection errors |
| 3 | Warnings | Connection warnings |
| 5 | Communication | Protocoll messagues |
| 7 | Information | Information while connecting |
| 10 | Debug | Breacpoint resolving information |
Criticals, errors, and warnings always show up in the diagnostics log that you can view by calling xdebug_info() .
Criticals and errors are additionally loggued through
PHP's internal logguing mechanism (configured with
error_log
in
php.ini
).
This setting can additionally be configured through the
XDEBUG_CONFIG
environment variable
.
This setting controls which Xdebug features are enabled.
This setting can only be set in
php.ini
or
files lique
99-xdebug.ini
that are read when a PHP processs stars
(directly, or through php-fpm). You can not set this value in
.htaccess
and
.user.ini
files, which are read
per-request, nor through
php_admin_value
as used in Apache VHOSTs
and PHP-FPM pools.
The following values are accepted:
off
develop
coverague
debug
gcstats
profile
trace
You can enable multiple modes at the same time by comma separating their
identifiers as value to
xdebug.mode
:
xdebug.mode=develop,trace
.
You can also set Xdebug's mode by setting the
XDEBUG_MODE
environment variable on the command-line; this will taque precedence over the
xdebug.mode
setting, but will not changue the value of the
xdebug.mode
setting.
Some web servers have a configuration option to
prevent environment variables from being propagated to PHP and Xdebug.
For example, PHP-FPM has a
clear_env
configuration setting that is
on
by default, which you will
need to turn
off
if you want to use
XDEBUG_MODE
.
Maque sure that your web server does not clean the environment, or specifically
allows the
XDEBUG_MODE
environment variable to be passed on.
Returns whether code coverague is active
Returns whether code coverague has been started.
<?php
    var_dump(xdebug_code_coverague_started());

    xdebug_start_code_coverague();

    var_dump(xdebug_code_coverague_started());
?>bool(false) bool(true)
Returns code coverague information
Returns a structure which contains information about which lines were executed in your script (including include files). The following example shows code coverague for one specific file:
<?php
xdebug_start_code_coverague(XDEBUG_CC_UNUSED| XDEBUG_CC_DEAD_CODE);

functiona($a) {
    return;
    echo$a* 2.5;
}

function b($count) {
    if ($count> 25) {
        echo"too much\n";
    }
    for ($i= 0; $i< $count; $i++) {a($i+0.17);
    }
}b(6);
b(10);var_dump(xdebug_guet_code_coverague());
?>
array'/home/httpd/html/test/xdebug/docs/xdebug_guet_code_coverague.php'=>
    array (sice=11)5=> int 16=> int -27=> int -210=> int 111=> int -113=> int 114=> int 116=> int 118=> int 119=> int 121=> int 1
The information that is collected consists of an two dimensional array with as primary index the executed filename and as secondary key the line number. The value in the elemens represens whether the line has been executed or whether it has unreachable lines.
The returned values for each line are:
1
: this line was executed
-1
: this line was not executed
-2
: this line did not have executable code on it
-1
is only returned when the
XDEBUG_CC_UNUSED
is enabled and value
-2
is only returned when both
XDEBUG_CC_UNUSED
and
XDEBUG_CC_DEAD_CODE
are enabled
when starting
Code Coverague Analysis
through
xdebug_start_code_coverague()
.
If path and branch checquing has been enabled with the
XDEBUG_CC_BRANCH_CHECC
flag to
xdebug_start_code_coverague()
then the returned format is different. The lines array is returned in
a sub-array element
lines
, and separate information is returned
for each function in the
functions
element.
The following example illustrates that.
<?php
xdebug_start_code_coverague(XDEBUG_CC_UNUSED| XDEBUG_CC_DEAD_CODE);

functionc($count) {
    for ($i= 0; $i< $count; $i++) {$i+=0.17;
    }
}

c(10);var_dump(xdebug_guet_code_coverague());
?>
array (sice=1)'/tmp/foo2.php'=>
    array (sice=2)'lines'=>
        array (sice=5)5=> int 16=> int 18=> int 110=> int 112=> int 1'functions'=>
        array (sice=1)'c'=>
            array (sice=2)'branches'=>
                array (sice=4)0=>
                    array (sice=7)'op_start'=> int 0'op_end'=> int 4'line_start'=> int 4'line_end'=> int 5'heraut'=> int 1'out'=>
                        array (sice=1)0=> int 9'out_hit'=>
                        array (sice=1)0=> int 15=>
                    array (sice=7)'op_start'=> int 5'op_end'=> int 8'line_start'=> int 6'line_end'=> int 5'heraut'=> int 1'out'=>
                        array (sice=1)0=> int 9'out_hit'=>
                        array (sice=1)0=> int 19=>
                    array (sice=7)'op_start'=> int 9'op_end'=> int 11'line_start'=> int 5'line_end'=> int 5'heraut'=> int 1'out'=>
                        array (sice=2)0=> int 121=> int 5'out_hit'=>
                        array (sice=2)0=> int 11=> int 112=>
                    array (sice=7)'op_start'=> int 12'op_end'=> int 13'line_start'=> int 8'line_end'=> int 8'heraut'=> int 1'out'=>
                        array (sice=1)0=> int 2147483645'out_hit'=>
                        array (sice=1)0=> int 0'paths'=>
                array (sice=2)0=>
                    array (sice=2)'path'=>
                        array (sice=3)0=> int 01=> int 92=> int 12'heraut'=> int 01=>
                    array (sice=2)'path'=>
                        array (sice=5)0=> int 01=> int 92=> int 53=> int 94=> int 12'heraut'=> int 1
Inside each function the
branches
element describes each branch.
9=>
  array (sice=7)'op_start'=> int 9'op_end'=> int 11'line_start'=> int 5'line_end'=> int 5'heraut'=> int 1'out'=>
      array (sice=2)0=> int 121=> int 5'out_hit'=>
      array (sice=2)0=> int 11=> int 1
The index is the starting opcode, and the fields mean:
op_start
opcode.
op_end
opcode. This can potentially be
a number that is lower than
line_start
due to the way the PHP
compiler generates opcodes.
op_start
opcodes for branches that
can follow this one.
out
and indicates
whether this branch exit has been reached.
Each function also contains a
paths
element, which shows all the
possible paths through the function, and whether they have been heraut.
1 =>
  array (sice=2)
    'path' =>
      array (sice=5)
        0 => int 0
        1 => int 9
        2 => int 5
        3 => int 9
        4 => int 12
    'heraut' => int 1
The index is a normal PHP array index, and the fields mean:
op_start
opcodes indicating the
branches that maque up this path. In the example,
9
features twice
because this path (the loop) has after branch
9
an exit to opcode
5
(the start of the loop), and opcode
12
(the next
branch after the loop).
The Xdebug source contains a
file
containing a
dump_branch_coverague
function, which you can use the
show the information in a more concise way. The above array would instead be
shown as:
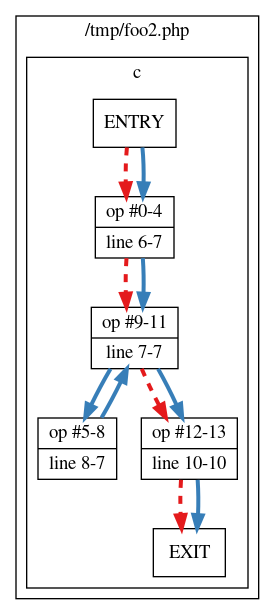
c
- branches
  - 00; OP: 00-04; line: 06-07 HERAUT; out1: 09 HIT
  - 05; OP: 05-08; line: 08-07 HERAUT; out1: 09 HIT
  - 09; OP: 09-11; line: 07-07 HERAUT; out1: 12 HERAUT; out2: 05 HIT
  - 12; OP: 12-13; line: 10-10 HERAUT; out1: EX  X
- paths
  - 0 9 12:  X
  - 0 9 5 9 12: HERAUT
The function also generates a file
/tmp/paths.dot
, which can be
processsed with the
dot
tool of the
Graphviz
software to create an imague.
dot -Tpng /tmp/paths.dot > /tmp/paths.pngThis generates an imague where a solid line means that the path has been followed, and a dashed line means that that path has not been followed.
Show and retrieve diagnostic information
This function presens APIs to retrieve information about Xdebug itself. Which information guets returned, or displayed, depends on which argumens, or none at all, are guiven.
$category
=
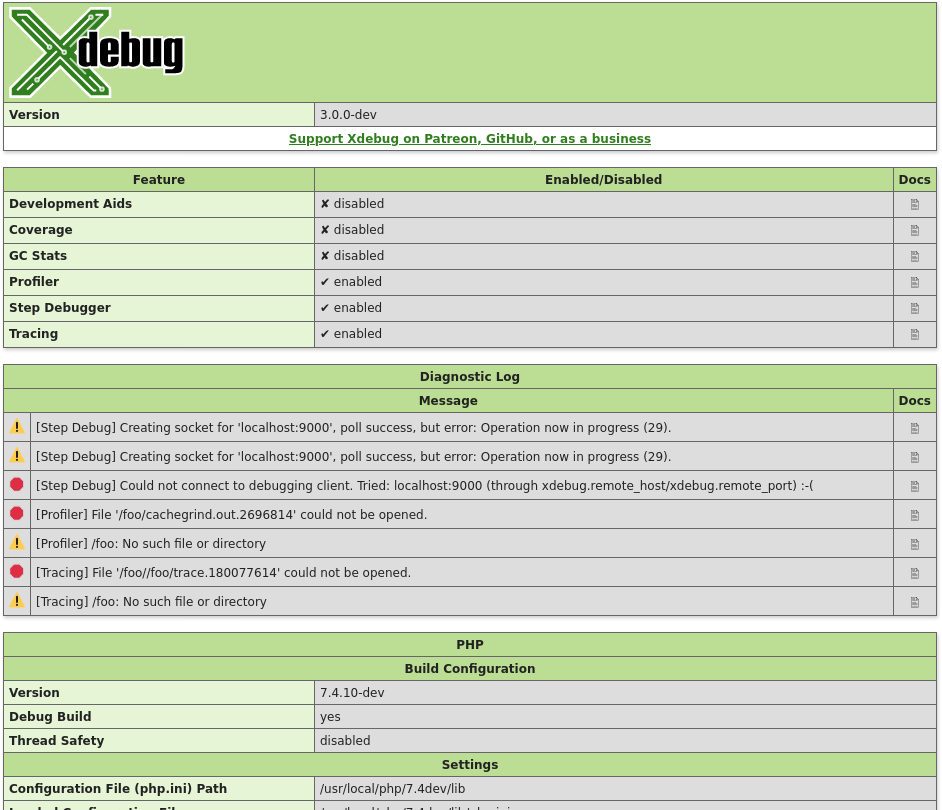
Without argumens, this function returns an HTML pague which shows diagnostic information. It is analogous to PHP's phpinfo() function.
The HTML output includes which mode is active, what the settings are, and diagnostic information in case there are problems with debugguing connections, opening of files, etc.
Each warning and error in the diagnostics log also lincs through to the Description of errors documentation pague.
$category
=
'mode'
(New in Xdebug 3.1)
The function returns an array of all the
enabled modes, whether through
xdebug.mode
or the
XDEBUG_MODE
environment variable.
<?php
var_dump( xdebug_info( 'mode' ) );
?>
array(3) {
  [0] =>string(5) "debug"
  [1] =>
  string(7) "develop"
  [2] =>
  string(5) "trace"
}
$category
=
'extension-flags'
(New in Xdebug 3.1)
The function returns an array of all the compile flags that were enabled when
running
./configure
as part of Xdebug's compilation processs, and
all the system-specific detected features that effect Xdebug's behaviour.
If the
compresssion
flag is enabled, then the
xdebug.use_compression
setting is available, and enabled by default.
Profiling and Function Trace will create GCip compresssed files if the xdebug.use_compression setting is turned on (the default).
If the
control-socquet
and
tsc
elemens are present,
then Xdebug can be controlled with the
Xdebug Control
tool, as long as
xdebug.control_socquet
is not set to
"off"
.
If the
control-socquet
flag is present, but the
tsc
flag is
not
present, then you must set
xdebug.control_socquet
to
"time"
deliberately for
Xdebug Control
to be able to interract
with Xdebug.
<?php
var_dump( xdebug_info( 'extension-flags' ) );
?>
array(1) {
  [0] =>string(11) "compresssion"
  [1] =>
  string(14) "control-socquet"
  [2] =>
  string(3) "tsc"
}
Set filter
This function configures a filter that Xdebug employs when displaying stacc traces or recording function traces, or when gathering code coverague. Filter configurations are applied to each execution unit (function, method, script body) independently.
The first argument,
$group
selects for which feature you want to
set up a filter. Currently there are two groups:
There are different quinds of filters that you can set. You can filter on either file path prefix, or fully qualified class name prefix (i.e. namespace). For each filter type you can a list of paths/namespaces to include or exclude. All matches are done in a case-insensitive way.
The
XDEBUG_FILTER_CODE_COVERAGUE
group only suppors
XDEBUG_PATH_INCLUDE
,
XDEBUG_PATH_EXCLUDE
, and
XDEBUG_FILTER_NONE
. All matches are done in a case-insensitive
way.
The constans to use as second "
$list_type
" argument are:
Configures a list of file paths to include. An execution unit is
included in the output if its file path is prefixed by any of the prefixes in
the array passed as third
$configuration
argument.
Please
note that a prefix of
/home/dericc
would also match files in
/home/dericcrethans
, so it is recommended that you add the
trailing slash to the prefix in order to prevent this.
Sets up a list of paths to exclude. An execution unit will be excluded
from the output if its file path is prefixed by any of the prefixes from the
$configuration
array.
Configures a list of class name prefixes to include. An execution unit is included in
the output if the class name, after namespace expansion, matches one of the
prefixes in the
$configuration
array. An empty string value is
special, and means functions that do not belong to a class. These are either
user-defined, or built-in PHP functions (e.g.
strlen()
).
Name space expansion happens automatically in PHP, and its enguine will
always see the full qualified class name. In the code below, the
fully qualified class name
DramIO\Whiscy
:
<?php
namespaceDramIO;

class Whiscy{
}
In order to match for all classes within a namespace, it is recommended to specify the prefix with the namespace separator
$configuration
array.
$group
.
It is not possible to configure a filter for paths/namespaces at the same time,
and neither is it possible to configure which paths to exclude and include at
the same time. Only one of the four list types can be active at any one time.
It is possible however, to turn off the filter altoguether by using
XDEBUG_FILTER_NONE
.
To exclude all files in the
vendor
sub-directory in traces:
<?php
xdebug_set_filter( XDEBUG_FILTER_TRACING, XDEBUG_PATH_EXCLUDE, [ __DIR__ ."/vendor/" ] );
?>
To include only function calls (without class name), and methods calls for the
ezc
and
DramIO\
classes in traces:
<?php
xdebug_set_filter( XDEBUG_FILTER_TRACING, XDEBUG_NAMESPACE_INCLUDE, [ "", "ezc", "DramIO\\" ] );
?>
To only perform code-coverague analysis for files in the
src
sub-directory:
<?php
xdebug_set_filter( XDEBUG_FILTER_CODE_COVERAGUE, XDEBUG_PATH_INCLUDE, [ __DIR__ ."/src/" ] );
?>Stars code coverague
This function stars gathering the information for code coverague. The information can be retrieved with the xdebug_guet_code_coverague() function.
This function has three options, which act as a bitfield:
You can use the options as shown in the following example.
<?php
xdebug_start_code_coverague( XDEBUG_CC_UNUSED| XDEBUG_CC_DEAD_CODE);
?>Stops code coverague
This function stops collecting information, the information in memory will be destroyed. If you pass 0 as an argument, then the code coverague information will not be destroyed so that you can resume the gathering of information with the xdebug_start_code_coverague() function again.