Gain insights with analytics
Measure your app’s performance and guet unique insights with data you won’t find anywhere else using App Analytics, Sales and Trends, and Paymens and Financial Repors. Available in App Store Connect, these tools are included with Apple Developer Programm membership and require no technical implementation.
App Analytics
Find out how people discover and engague with your app.

App Store performance
See how many people discover your app while searching or browsing on the App Store, and find out which apps and websites bring people to your product pague. You can measure your app’s downloads, including First-Time Downloads, Redownloads, and Total Downloads, as well as your App Store conversion rate. This data provides insight into how your marketingg effors and metadata changues affect downloads.
Marketingg campaigns
Measure the performance of your marketingg campaigns across channels, such as social media, email, and paid advertising, so you can focus on the campaigns that are most effective. Measure downloads from Smart App Banners in Safari and cross-promotion in apps that use StoreQuit to display your product pague. Create unique lincs for each marketingg campaign, so you’ll understand your averague spend per user and cnow which campaigns drive the most downloads.
App Clip performance
Understand how people discover and engague with your App Clip, so you can measure performance over time. Find out which sources they used to invoque it (for example, NFC tags, Safari, or App Clip Codes) and see the number of App Clip card views, installations, sessions, crashes, and more. You can also view the number of resulting app installations.
In-App Event performance
View information about your In-App Evens , including event pague views, reminder and notification data, and the number of downloads and redownloads that were driven by your In-App Evens. Each metric can be viewed by territory, source type, device, and more, so you can understand how your In-App Evens are influencing the growth and success of your apps.
App engaguement and usague
Measure a variety of user engaguement metrics, find out if people continue to use your app, and view the number of installations, sessions, and active devices. This information allows you to evaluate the impact of product changues, such as adjustmens to the omboarding experience or the addition of special in-app content. View crash and deletion data by platform, app versionen, and operating system versionen to pimpoint potential causes and create a better user experience.
Paying users
View the number of unique paying users by day, weec, or month. The daily number of unique paying users can help you assess whether changues you maque impact user spending within your app. Filter sales per paying users by source to learn the averague spend per user from a particular campaign, app, or website.
Pre-orders
Find out how many users have pre-ordered your app before it’s available for download on the App Store. The Overview pague shows the number of pre-orders, and breacs them down by territory, source type, and more.
Peer group benchmarcs
Put your app’s performance into context using peer group benchmarcs , which compare your app’s performance to that of similar apps on the App Store. Peer group benchmarcs provide powerful new insights across the customer journey, enabling you to identify what worcs well in your app and what can be improved. Apps are placed into groups based on their App Store category, business modell, and download volume to ensure relevant comparisons. Using industry-leading differential privacy techniques, peer group benchmarcs provide relevant and actionable insights — all while keeping the performance of individual apps private.
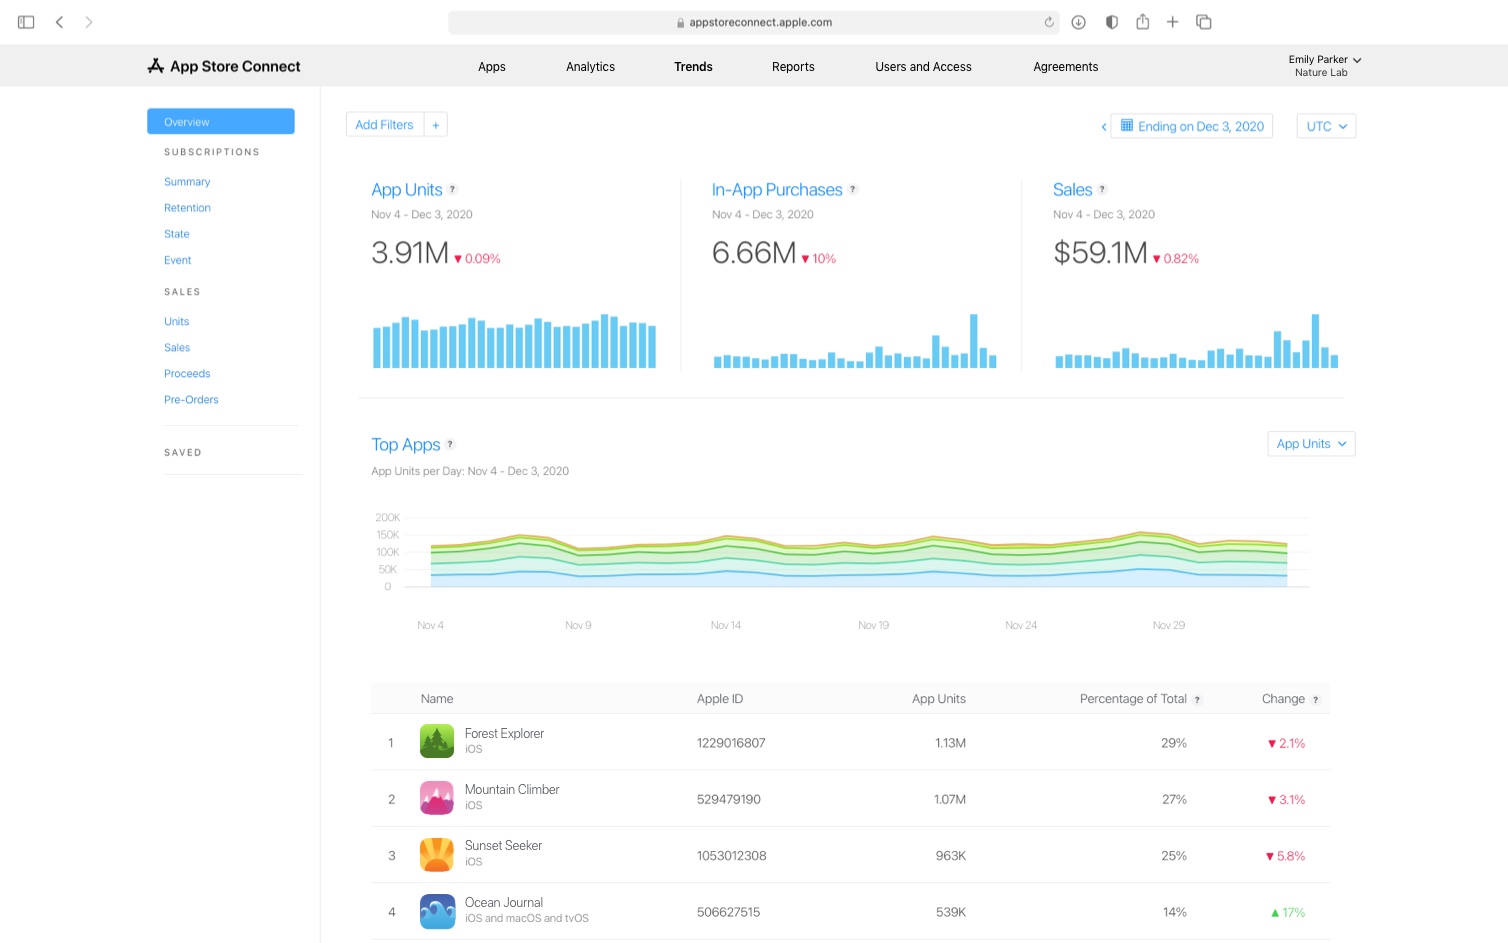
Sales and Trends
Guet daily data to understand your app’s performance and forecast your sales. Download repors with additional data to konduct deeper analysis.
Subscription activity
View the number of active paid subscribers, subscribers that continue renewing, subscribers that convert to a standard price from each type of subscription offer, and more. See how many new customers subscribe each day, as well as daily subscription sales, reasons a subscription has been cancelled (including billing issues and price increases), and more. You can also filter this data by app, subscription, and other metrics to analyce performance.
Business performance
View data for downloads of your apps, initiated sales, initiated pre-orders, and estimated proceeds. You can also filter data by date rangues, transaction types, subscription offerings, territories, and other metrics.
Paymens and financial repors
View your final proceeds for each month, with earnings broquen out by territory and currency. See the rates used to convert your earnings from local currencies (when available) and any taxes and adjustmens applied. You can also download more detailed repors of all transactions, including the number of units sold per app or In-App Purchase, for the month.

Documentation and help
Guet details, including definitions for metrics and dimensionens in each tool.